James Bullard and the case of the ‘wandering regimes’

In London, recently, St Louis Fed president James Bullard restated the Bank´s ‘new view’:

The St. Louis Fed had been using an older narrative since the financial crisis ended. That narrative has now likely outlived its usefulness, and so it is being replaced by a new narrative. The hallmark of the new narrative is to think of medium- and longer-term macroeconomic outcomes in terms of regimes. In this new narrative, the concept of a single, long-run steady state to which the economy is converging is abandoned, and is replaced by a set of possible regimes that the economy may visit. Regimes are generally viewed as persistent, and optimal monetary policy is viewed as regime dependent. Switches between regimes are viewed as not forecastable.

Unfortunately, Bullard gets it wrong. It is not monetary policy that is regime dependent but regimes that are monetary policy dependent. In other words, the Fed is not passive, but instrumental in building regimes.

History is very clear on that point.

In the 1960s, monetary policy worked double-shift to build the high inflation (“Great Inflation”) regime that blossomed in the 1970s.

According to Arthur Okun, Council of Economic Advisers (CEA) staff member (1961-62), member (1964-67) and Chairman (1968-69):

The stimulus to the economy also reflected a unique partnership between fiscal and monetary policy. Basically, monetary policy was accommodative while fiscal policy was the active partner. The Federal Reserve allowed the demands for liquidity and credit generated by a rapidly expanding economy to be met at stable interest rates

Throughout the 1970s, Fed Chairman Arthur Burns conducted monetary policy in such a way as to entrench the “Great Inflation” regime. According to Burns:

We are in the transitional period of cost-push inflation, and we therefore need to adjust our policies to the special character of the inflationary pressures that we are now experiencing. An effort to offset, through monetary and fiscal restraints, all of the upward push that rising costs are now exerting on prices would be most unwise. Such an effort would restrict aggregate demand so severely as to increase greatly the risks of a very serious business recession.

In his view, monetary policy could at most mitigate the unemployment effects of supply shocks. No wonder nominal spending growth showed a rapidly rising upward trend all through the 1970s. High and rising inflation was the consequence.

Later, Paul Volcker worked hard to change the regime. In his first FOMC meeting as Chairman in 1979, Volcker “defined his moment” by asserting:

Economic policy has a kind of crisis of credibility. As a result, dramatic action to combat inflation would not receive public support without more of a crisis atmosphere.

I define the seven-year period going from the fourth quarter of 1979 to the fourth quarter of 1986 as the “Volcker Transition.” That is when the US economy transitioned from a high inflation and high volatility regime, to one characterized by more-stable real output and lower and steadier rates of inflation. The result of the Volcker Transition is the “Great Moderation” that extends, under Greenspan, from 1987 to 2007.

Bernanke´s misguided monetary policy, heavily influenced by fears of inflation from oil price shocks, broke the spell. The outcome was the “Great Recession” regime, quickly followed by the “Great Stagnation” regime.

This is a good place to introduce another Fed Bank that does not capture the fact that monetary policy is vital in determining the regime. Four years ago, Liberty Street, the blog of the New York Fed wrote The Great Moderation, Forecast Uncertainty, and the Great Recession:

The Great Recession of 2007-09 was a dramatic macroeconomic event, marked by a severe contraction in economic activity and a significant fall in inflation. These developments surprised many economists, as documented in a recent post on this site. One factor cited for the failure to anticipate the magnitude of the Great Recession was a form of complacency affecting forecasters in the wake of the so-called Great Moderation. In this post, we attempt to quantify the role the Great Moderation played in making the Great Recession appear nearly impossible in the eyes of macroeconomists.

And concludes:

 In sum, our calculations suggest that the Great Recession was indeed entirely off the radar of a standard macroeconomic model estimated with data drawn exclusively from the Great Moderation. By contrast, the extreme events of 2008-09 are seen as far from impossible—if unlikely—by the same model when the shocks hitting the economy are gauged using data from a longer period (third-quarter 1954 to fourth-quarter 2007). These results provide a simple quantitative illustration of the extent to which the Great Moderation, and more specifically the assumption that the tranquil environment characterizing it was permanent, might have led economists to greatly underestimate the possibility of a Great Recession.

From reading Bullard, that´s exactly what you would get because:

The upshot is that the new approach delivers a very simple forecast of U.S. macroeconomic outcomes over the next two and a half years. Over this horizon, the forecast is for real output growth of 2 percent, an unemployment rate of 4.7 percent, and trimmed-mean personal consumption expenditures (PCE) inflation of 2 percent. In light of this new approach and the associated forecast, the appropriate regime-dependent policy rate path is 63 basis points over the forecast horizon.

The chart below comprises the period considered by Liberty Street. Note that in the late 50s, the relatively small and brief negative NGDP growth was sufficient to thump RGDP growth, even harder than the supply shocks of the 70s or the tightening of spending during the Volcker Transition.

Wandering Regimes

According to Robert Lucas (Econometric Policy Evaluation, a critique, 1976), forecasts are regime dependent. So, if you change policy, you change the regime (and also the forecasts).

Liberty Street estimates the model across regimes, so that the Great Recession becomes “far from impossible”.

I identify the Great Stagnation regime as a low volatility regime. That characteristic (low vol) is shared with the Great Moderation regime. But that is very misleading. Once you take into account the different nominal and real growth rates in the two periods, you understand how “sub-optimal” the present regime is!

The Tables below illustrates for the 2010-2016 and 1992-1997 (halcyon days of the Great Moderation).

NGDP 2010 – 2016 1992 – 1997
Growth (% YoY) 3.7% 5.6%
Standard Deviation 0.7 0.7
RGDP
Growth (% YoY) 2.1% 3.5%
Standard Deviation 0.6 0.8
CPI Core
% YoY 1.5% 2.1%
Standard Deviation 0.4 0.5

Certainly a steep price to pay for having inflation a bit below target!

Where do “beliefs” come from?

Blanchard & Posen are “believers:

“I have a sense that the recovery is slow but it is not in great danger, at least no more than usual,” Mr Blanchard says. “We can talk about risks, they are always there. But the notion that around the corner there is a catastrophe waiting — that really strikes me as totally off.

“For the last seven years we have been thinking about the legacies of the crisis and all the things that have pulled the economy back. I think they are becoming less important,” Mr Blanchard argues, adding: “And so the question is why is it, that with no fiscal consolidation and banks in decent shape, at least in terms of lending, and zero interest rates, we don’t have an enormous demand boom? That is now the puzzle.”

The answer, he suspects, lies in a concern about the future that has led consumers to curb their spending and companies to decrease investment. “I think it is now much more weakness due to the expected future rather than the past,” he says.

That, says Mr Posen, ought to be depressing. But the reality is that the world has also for the first time in a long while found “a sustainable rate of growth”.

Mr Blanchard thinks the biggest risk for the US economy may be that markets are misreading the data and being too gloomy instead of recognising that the recovery is “one of the most balanced … we have had in a long time”.

And to top it off:

Yet in the end, he argues: “You could avoid some of this mess … by just switching to expansionary fiscal policy.”

They should have a better reading of history.

The world even managed to recover from the Great Depression (for the US it happened before it got into WWII). Why not from a much “milder” one?

Beliefs

And calling this “recovery” as “one of the most balanced” borders on criminal!

Larry Summers discusses the Great Stagnation

In “Larry Summers: Where Paul Krugman and I differ on secular stagnation” :

The topic of the debate was: “North America faces a Japan-style era of high unemployment and low growth.” Paul argued in favor. I opposed the motion — not on the grounds that the U.S. economy was in good shape, but on the grounds that our demand deficiency problems should be easier to solve than Japan’s…

And wraps up:

This is true and an important insight. But it seems to elide the main issue. Where is the deus ex machina? Where is the can opener? The essence of the secular stagnation and hysteresis ideas that I have been pushing is that there is no assurance that capitalist economies, when plunged into downturn, will, over any interval, revert to what had been normal. Understanding this phenomenon and responding to it seems the central challenge for macroeconomics in this era.

Any analysis that assumes restoration of previous equilibrium is, from this perspective, missing the main issue. I was glad to see Paul recognize this point recently.  I suspect it will lead to more emphasis on fiscal rather than monetary actions in depressed economies.

Summers is right about the relative seriousness of the Japanese demand deficiency problem. Japan´s monetary blunder was “criminal”, and the fiscal action that followed was nothing less than overwhelming (with countless bridges, some to nowhere, and even an airport over water). However, that did not help at all given the “dead in the water” monetary policy!

The two charts illustrate. The Japan NGDP trend is estimated for 1980-91, while the US trend is the Great Moderation trend established during 1987-97.

L Summers_GS


Revisionist Thoughts: Was Australia just luckier than most?

This post was motivated by Scott Sumner´s musings about Australia: Australia´s Great Stagnation:

It looks like the Great Stagnation has hit even Australia.  In an earlier post I pointed out that Australian NGDP rose at a 6.5% rate from 1996:2 to 2006:2.  Then we had the Global Financial Crisis, and Australian NGDP growth slowed to . . . er . . . it stayed at 6.5% from 2006:2 to 2012:2.  No tight money and no recession in Australia.

Some important facts about Australia:

1 NGDP and Trend

Revisionist Thought_1

2 RGDP & Trend

Revisionist Thought_2

Notice that when NGDP climbs above trend, RGDP falls below trend!

Zooming in (circles explained later)

Revisionist Thought_3

Revisionist Thought_4

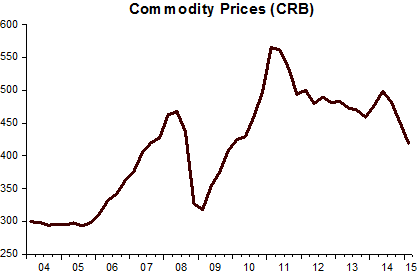
What explains the counterintuitive fact that RGDP falls below trend at the same time commodity prices take off?

Revisionist Thought_5

The rise in NGDP translates into a rise above target in core inflation.

Revisionist Thought_6

The 200 basis points increase in the cash rate (equivalent to the Fed´s FF rate) just goes to show that interest rates are bad definers of the stance of monetary policy. Despite the increase in the cash rate, inflation and NGDP were moving up, indicating monetary policy was “too easy”!

Revisionist Thought_7

With Australia being a commodity exporter, another way to gauge the stance of monetary policy is by comparing the move in the exchange rate to the dollar and commodity prices. Monetary policy is “just right” if a rise in commodity prices is accompanied by an appreciation of the Aussie Dollar (USD/A$) and a fall in commodity prices goes hand in hand with a depreciation of the exchange rate.

The chart below shows that in 2004-07 monetary policy was too loose, consistent with NGDP climbing above trend (and inflation increasing). Monetary policy was tightened in 2011-13, consistent with NGDP converging to trend and inflation decreasing (see circles in NGDP & Trend chart above).

Revisionist Thought_8

At present, NGDP is back on trend (actually just a “whisker” below it). What happens next? Will Australia go the way of Sweden, Israel and Poland, or will it get “smart”?

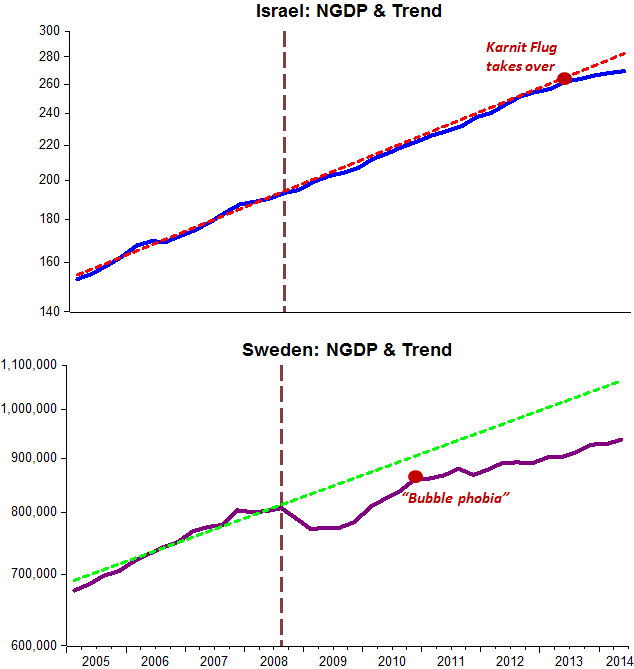
In the case of Sweden things started unraveling when the Riksbank decided to “prick” a housing “bubble”. According to the FT:

Sweden’s central bank has been lambasted by critics for trying to use interest rates to combat signs of a housing bubble. It lifted rates in 2010 and 2011 as it publicly worried about what it saw as high household debt levels.

In the case of Israel, it may not be coincidence that NGDP began a systematic deviation from trend when Ms Flug took over at the Bank of Israel. Maybe she prefers the role of Finance Minister:

Speaking at a Calcalist conference, Governor of the Bank of Israel said today, “Exceeding the 3% fiscal deficit target will expose the Israeli economy to significant risk and will be liable to harm us citizens. We must show responsibility and take into account the consequences of our decisions over time. Israel’s structural deficit, the deficit not subject to one-time shocks, is already one of the highest in the western world.”

This is what happened:

Revisionist Thought_9

In the case of Poland, it took three years, but in late 2011 Poland finally botched up and went the way of the majority of countries, letting NGDP fall way below trend. They didn´t (correctly) react to the 2007-08 oil price rise, like the US, UK, EZ, etc. and fared well, but didn´t resist when oil prices picked up again in 2010-11, when, among the initial group, only the ECB was dumb enough to react.

Revisionist Thought_10

By talking about house prices, the RBA is tempting the “fate” that hit Sweden and Israel. Scott links to an article in a subsequent post:

The Reserve Bank of Australia’s surprise decision to defer its widely anticipated April rate cut for at least another month might have been influenced by the increasingly pricey housing market, which it regards as posing a real “dilemma”.

This, unfortunately, has been going on for some time. Last September, RBA Governor Glenn Stevens was warning of bubble risk in the current low interest rate environment:

Addressing members of the Committee for Economic Development of Australia (CEDA) lunch in Adelaide, he said monetary policy aimed at encouraging business investment and generating employment amid global economic weakness was in danger of creating a housing bubble in Australia.

And the next chart compares two “bubbles”.

Revisionist Thought_11

Please, Governor Stevens, start thinking smart!

Even a Great Stagnation requires planning!

In a recent post, Nick Rowe gives a short reply to DeLong´s long post:

Suppose you lived in a world where, whenever the price level fell/rose by 1%, the central bank responded by decreasing/increasing the base money stock by the same 1%. A world like that would not have a long-run Omega point, from which some present equilibrium can be pinned down by back propagation induction.

That’s the sort of world we live in, under the inflation targeting regime. A drunk doing a random walk does not have a destination, from which we can infer his route by working backwards. His long run variance is infinite.

Stop arguing about whether a market macroeconomy is or is not inherently ultimately self-equilibratingIt’s a stupid question. It depends. It depends on the monetary regime.

Instead, let’s solve the stupid question by adopting a nominal level path target.

It´s even worse. If you don´t plan, i.e. provide a “destination” for it, even a “Great Stagnation” becomes “random”!

The charts illustrate.

Destination Required_1

Destination Required_2

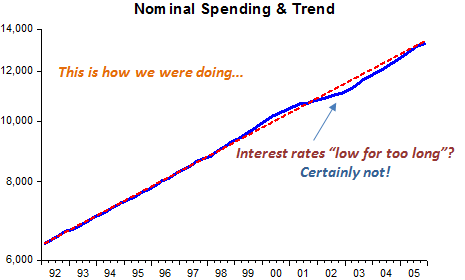
The first shows why the “Great Moderation” happened. The “destination” was the trend level path, to which the economy returned after monetary policy mistakes dislodged it. Observe what many called a period of “too low for too long” rates doesn´t look like that at all!

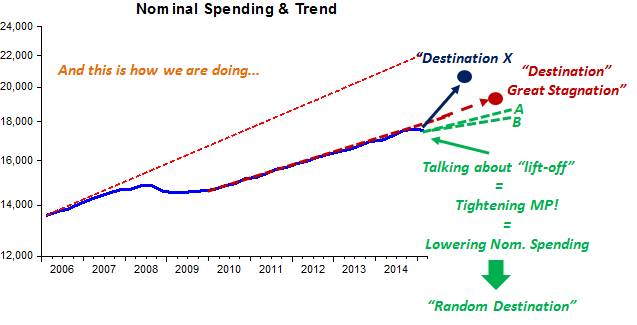
In the second chart, we note that after the Fed pulled the economy down, it has been satisfied in keeping it down, i.e. “depressed”. It could come out and say that that´s the path (“destination”) it wants it to follow. But no, by saying it´s about time to “tighten” policy, it is implying that the path might be even lower. Is it A? Is it B? The truth is no one knows!

It certainly does not appear to be X!

Related: David Glasner, Scott Sumner