“Nobel wager”

Gregory Mankiw provoked Krugman in March 2009. In “Wanna bet some of that Nobel money?” he writes:

Paul Krugman suggests that my skepticism about the administration’s growth forecast over the next few years is somehow “evil.” Well, Paul, if you are so confident in this forecast, would you like to place a wager on it and take advantage of my wickedness?

Team Obama says that real GDP in 2013 will be 15.6 percent above real GDP in 2008. (That number comes from compounding their predicted growth rates for these five years.) So, Paul, are you willing to wager that the economy will meet or exceed this benchmark? I am not much of a gambler, but that is a bet I would be happy to take the other side of (even as I hope to lose, for the sake of the economy).

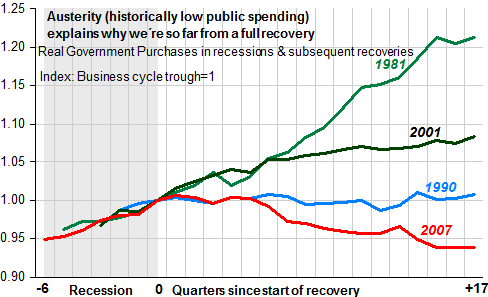
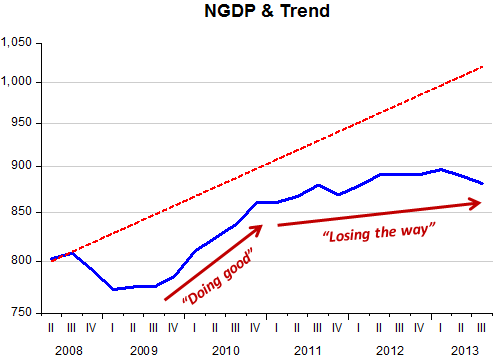
Krugman “lost” the bet by a wide margin. In 2013 Q3 RGDP is only 8.7% above the level observed in 2008 Q4.

The basis for the “bet” revolved around the concept of “unit root”. Market Monetarists would have bet that if monetary policy remained tight (NGDP way below trend and growing less than trend) RGDP would fall short of the administration´s predictions. Five years on we know that monetary policy has been restrictive so the weak result for real output was not surprising.

For details, see here.

HT Catherine Johnson

“Never reason from the previous peak”

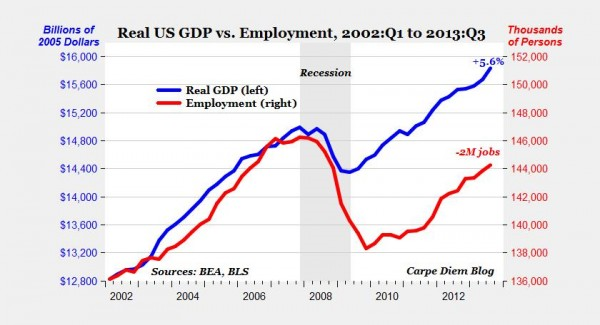
In “The current state of the US economy explained in one chart”, Mark Perry shows this chart:

Never reason from the previous peak_1

And asserts, inter alia, that:

2. While the US economy was able to achieve a complete recovery from the Great Recession (in terms of real GDP), and is now producing $843 billion more output than in Q4 2007, the new record level of economic output in the US is being produced with two million fewer workers than in the last quarter of 2007 (see red line in chart).

4. The chart above also illustrates the fact that the US economy is in another “jobless recovery,” with a full economic recovery when measured by real output, but with a weak recovery when measured by employment levels, with a stubbornly high jobless rate and sluggish job growth.

As I argued in “The previous peak is not the appropriate benchmark” (Parts 1 & 2), just because you´ve reached or surpassed the previous peak does not mean you have achieved a complete or full recovery.

The chart below indicates that the economy is far below it´s “potential” level (even if you reduce the level of potential and it´s growth rate after 2009).

Never reason from the previous peak_2

It appears that the recovery is far from complete. The fact that fewer workers are producing more output than at the 2007 peak is also no mystery. Take a look at how much higher the productivity level is!

Never reason from the previous peak_3

The next chart indicates that the level of employment is related to the level of nominal spending (NGDP). Employment has been slowly rising since the recovery began in mid-2009 because the NGDP gap is slowly narrowing. You wouldn´t see a rise in employment if the “original” gap were still valid. The recession has reduced both the level of spending and it´s trend growth rate. You could charge this to hysteresis effects, but mostly it´s due to the persistent tightness of monetary policy, that allowed NGDP to drop so far below trend.

Never reason from the previous peak_4

Monetary Policy trumps Fiscal Policy

The Economic Policy Institute (EPI) twitted a version of the chart below which purports to show that if only fiscal policy had not been so austere, the economy would be much further on the way to recovery.

EPI_1

Seems we are reliving the 1960s debates over the relative effectiveness of fiscal and monetary policy!

We know that the recovery from the 2007-09 recession has been the weakest ever. But is that really due to “austerity”? Note that during the 2007-09 recession the growth of real public spending was just as strong as during the other recessions, but that didn´t stop this recession from being the most virulent.

But the chart provides us with a chance to test the “fiscal rules” proposition. Observe that real government spending was much stronger following the 2001 recession than following the 1990 recession. In fact, following the 1990 recession government spending basically stayed ‘put’. Ceteris Paribus, one could surmise that the recovery from the 2001 recession was more pungent than that following the 1990 one.

The chart below provides a visual of the ‘recovery landscape’ through the prism of real output after the more recent recessions.

EPI_2

The 1990 and 2001 recovery show the same behavior of real output despite the large difference in real government spending. It appears the ‘ordering’ of recoveries is not defined by the ‘ordering’ of government spending.

The next chart shows the behavior of nominal spending (NGDP) across recessions. It appears that that´s what determines the ‘ordering’ of recoveries. The similarity in the expansion following the recessions of 1990 and 2001 appears to be due to the similar increase in NGDP on both occasions (despite very different fiscal actions). I think the more robust expansion following the 1981 recession and the weak recovery following the 2007 recession are related to the very different behavior of NGDP. And the behavior of NGDP is directly determined by monetary policy!

EPI_3

Sweden´s loss of ‘faith’

Per Bylund argues for fiscal consolidation but forgets the important role of monetary policy:

Since 1992, Sweden has, across the board, seen consistent government cutbacks while increasing restrictions on welfare policies, deregulating markets, and privatizing former government monopolies. The country has instituted an overall new incentive structure in society making it more favorable to work. The national debt tumbled from almost 80 percent of GDP in 1995 to only 35 percent in 2010.

In other words, Sweden successfully rolled back its unsustainable but world-renowned welfare state. Despite Krugman’s wishful thinking, this is the real reason for Sweden’s success in riding out the present financial crisis.

Sweden surely got its act together in the early 1990s. The IMF numbers are a bit different but there´s no doubt a significant fiscal consolidation took place. The charts for the Government Debt/GDP and Government Balance/GDP ratios attest.

Sweden_1

But it was a good monetary policy, one that kept NGDP evolving along a stable level path that allowed fiscal consolidation to take place without negative effects on growth. The chart illustrates the real reason for Sweden´s success.

Sweden_2

Unfortunately, after a good reaction to the international crisis, the Riksbank savants soon got cold feet, worrying about inflation and real estate bubbles. So much so that after dissenting for many months Lars Svensson gave up and resigned. The chart shows that by early 2011 the Riksbank changed direction and stopped vying for the trend level of NGDP.

Sweden_3

Unemployment stopped falling and began to gently rise while inflation dropped far below target. Despite very low interest rates, monetary policy remains tight!

Sweden_4

In “5 takeaways on how Bernanke will be remembered”, pro or con, they all get it wrong!

What the 5 takeaways show is that since there is little understanding of the economic predicament, likely the economy will continue to row ‘against the current’.

Mark Gertler

Fortified by his knowledge of the Depression and no doubt inspired by Franklin Roosevelt’s example of fighting the Depression with “bold experimentation,” he spearheaded an aggressive and creative mix of central bank policy interventions to restore normalcy to financial markets.

His knowledge of the Great Depression was ‘misleading’. The bank failures followed the steep drop in nominal spending, just as it happened now.

John Taylor

Many will remember Ben Bernanke for classic central bank stabilizing actions taken by the Fed during the fall 2008 panic, including emergency loans to banks and swap lines to foreign central banks. But historians might also consider actions the Fed took before and after that panic.

From 2003 to 2005, shortly after Ben Bernanke joined the Board stressing deflationary concerns, the Fed embarked on a very low interest rate policy. The policy was rationalized in part by these deflationary concerns, but it was a deviation from a policy that had worked well for two decades, and it exacerbated the housing boom and led to excessive risk taking.

The fact was that between 2001-2003 nominal spending fell below trend. The policy followed by Greenspan (and Bernanke) after mid 2003, when they introduced forward guidance, was the correct one.

Mohamed El Erian

Mr. Bernanke’s courageous actions in 2008-09 helped the world avoid an economic depression that would have devastated millions of lives, as well as harm the prospects of the next generation. His bold design and rapid implementation of new Fed facilities succeeded in stopping cascading financial market failures, thus helping to interrupt an economic implosion and buy time for the economic system to heal.

Having succeeded in stabilizing the economy, Mr. Bernanke pivoted in 2010 from normalizing markets to assuming primary responsibility for delivering significantly higher economic growth and more dynamic job creation.

Bernanke the ‘savior’ has become a popular, but misguided, meme. What he did was badly try to undo his original mistake!

Michael Bordo

The prelude to 2007-2008 was the tech-stock bust of 2001 when Bernanke was a governor on the Fed board. Concerned about the possibility of deflation, as happened in Japan in the 1990s, he advocated a low fed funds rate from 2002 to 2006. In retrospect, this fear of deflation was overblown and low interest rates contributed to the housing boom.

Bordo has his dates all wrong. The tech crash took place in 2000 (not 2001) and Bernanke only became Fed Governor in September 2002, more than two years after the crash!

He makes the same mistake as John Taylor about the “low” rates ‘advocated’ (here also he gets the dates wrong!).

Lars Svensson

Ben Bernanke most likely saved the US and probably the world from the Great Recession turning into the Great Depression II. Trusting his judgment, his previous research on the Great Depression and on unconventional monetary policy with the policy rate at its lower bound (such as his 2004 Brookings paper with Vincent Reinhart and Brian Sack on large-scale asset purchases), he led Fed monetary policy out onto a limb to save the US economy . Without this, U.S. and world economic developments would have been inconceivably worse.

Again the misguided “Bernanke saved the world” meme!

The previous peak is not the appropriate benchmark – Part 2

After doing the previous post, I noticed that world recovery, either in terms of industrial output or trade, petered out at the same point in time (at the turn of 2011). I thought it would be interesting to check this out.

I only consider industrial production because trade is dependent, to a large extent, on what is happening to manufacturing activity.

I selected a group of “representative” countries. The US, Germany and Japan, together, account for more than one third of world output. Spain represents the “south” (of Europe), while Korea and Brazil are “representative agents” of newly industrialized and emerging markets, respectively.

Lackluster_1

Points to note:

  1. Korea and Brazil “hold out” for longer and begin the rebound sooner.
  2. The other countries fall and begin the rebound together.
  3. Spain´s ‘rebound’ means production stays flat.
  4. All countries stop rebounding at about the same time (late 2010/early 2011)
  5. While production in other countries stay ‘flat’, Spain experiences a second drop.
  6. For the past year (since the start of Abenomics) Japanese output trends ever so slightly up.
  7. During the QE between 2002 and 2006 Japanese industrial production showed a marked upward trend. Likely this will happen once again.

What´s driving this ‘lackluster’ process?

The next chart may provide a ‘motive’ for the lack of ‘energy’ observed in industrial production (and also in world trade). The chart shows the behavior of NGDP growth in both the US and Euro 17 countries (which represent a significant chunk of world demand).

Lackluster_2Note that the rebound in nominal demand growth peters out towards the end of 2010, at a level significantly below the pre-crisis growth and before anything approaching the previous level of demand was regained. In the EZ, in April and June 2011 the ECB thought it wise to raise interest rates! In the US the sequence of QEs certainly helped avoid an even bigger disaster. Avoiding disaster is good, but so much more could have been done. 

The previous peak is not the appropriate benchmark

At AEI Mark Perry writes: “A testament to economic resilience: World trade and output both reached new all-time record highs in October”:

Bottom Line: World industrial output and world merchandise trade both reached new record monthly highs in October. The volumes of world output and trade are now both solidly above their previous peaks during the early months of the global slowdown in 2008 (by 10.1% and 7.2% respectively), suggesting that the global economy has now made a complete recovery from the 2008-2009 economic slowdown.

Not quite. In the case of world industrial production it seems to have gotten stuck at a permanently lower (parallel) trend level.

Perry_1

In the case of the world trade volume, it is distancing from the previous trend, with a much reduced level (and growth rate) of trade suggesting the world economy is still mired in a depressed state!

Perry_2Update: Part 2 follows


Reappraising QE3

A guest post by Benjamin Cole

One might think that QE3—the U.S. Federal Reserve’s program of buying bonds with money it creates—has been an unmitigated disaster, judging from the relentless ranting from America’s right- and left-wing economists, pundits and bloggers.

In a nutshell: The righties hate monetary stimulus, and insist the Fed bring us to zero inflation, and the lefties think a bigger federal deficit is what we need.

But in fact, since September 2012—when the Fed went to open-end, results-dependent QE—has the US economy done so poorly?

Not so poorly.

The facts: Since QE3, the private-sector has created about 2.70 million jobs, or about 192,857 jobs each month. The 2013 third-quarter GDP figure was recently revised to 4.1 percent real growth, albeit with some caveats. Since QE3, the S&P 500 has gained more than 25 percent, auto sales are very strong, and median house prices are up by double-digits.

That open-ended QE3 is working is evidently driving lefties and righties nuts. More on that later.

Not Market Monetarism…But Close Enough?

To be sure, QE 3 is not yet Market Monetarism, in which a rules-based Fed would target a nominal GDP, with clear and transparent guidance as the norm.

Still, the current QE 3 program is somewhat results- or rules-dependent, in that the Fed somewhat said they would stick with QE until unemployment reached a low enough level, or inflation got too high. Unemployment is hardly the best target, but it is a rough proxy for NGDP growth. And inflation is, of course, a component of NGDP. There has been forward guidance, if too-often undercut by wayward FOMC members rhapsodizing about inflation.

As I have written before, one Fed chair may target inflation and employment, and the next NGDP growth, but if they both agree on $85 billion a month in QE, then they have the same policy regardless of complicated arguments undergirding their stances. There is some indication that Alan Greenspan, Fed chair from 1987 to 2006, was in essence targeting NGDP growth, consciously or otherwise. Despite recent bashing, his record in the Fed is one of very sustained good growth and low inflation—things went south after he left, remember?

Economists Turn to Voodoo

Unhappy with the relative success of QE3—and I think QE3 should be larger not smaller—America’s left- and right-wing economists have become increasing strained, exotic and strident in their denunciations of the Fed program.

After first declaring QE would axiomatically spell hyperinflation, we have otherwise serious right-wing economists proffering theories that QE is…deflationary.

“What if we have the sign wrong?” asks John Cochrane, University of Chicago star. Lower interest rates mean lower inflation rates, posit Cochrane and others. Not quite voodoo economics, but getting there. One suspects the cart is before the horse, no?

Top leftie Paul Krugman, for his part, insists that fiscal austerity is not working, and that we are in a vast liquidity quicksand—this despite the nearly 3 million jobs created since QE3, and a stock market up 25 percent. Such liquidity traps we can live with.

The Sad Part

The most lamentable aspect of the current economic “debate” is how rare are the economists pondering whether QE 3 should be more aggressive, or larger.

QE3 seems to be working, and inflation has sunk below one percent. Why not go larger? Or at least talk about it? (Scott Sumner, with his plan for a QE program that ramps up until targets are hit, is an exception.)

But economics has become a profession governed by social norms, scrims of indecipherable but fragile calculus and models, academic spitwad-fights and political agendas.

A peevish fixation on inflation governs the Fed and the mass of monetary thinkers (usually Fed-influenced), and the fiscalists think monetary policy is impotent.

Economics has become a profession in dire need of a shake-up, new blood, and intellectual diversity. QE3 looks like it is working, and without inflation. Maybe economists should try to explain that one.
Right before Christmas 100 years ago

The Fed was created! James Pethokoukis has a post in which he chronicles the Fed´s 3 epic failures. Here I´ll illustrate the failures from the perspective of NGDP and also show that for two decades the Fed got it mostly right.

The Great Depression: When the level of spending crashed. They didn´t learn the lesson because they managed to do a repeat performance eight years on, in 1937.

Fed 100_1

The Great Inflation: When the Fed thought that cranking up nominal spending was the best way to offset the effects of the oil shocks. And they kept saying that monetary policy could do little about inflation!

Fed 100_2

The Great Recession: When the Fed became obsessed with the inflation target and this time around thought that tightening monetary policy was the correct antidote to the oil price shock!

Fed 100_3

And the Great Moderation: When the Fed managed, by luck and/or design, to keep nominal spending evolving along a stable level path for most of the time.

Fed 100_4When will they ever learn“?

And as long as we believe in this, there´s not much hope:

What’s clear is that the Fed isn’t as powerful as it seemed under Greenspan. True, once Bernanke acknowledged the crisis, he acted forcefully to pump funds into the financial system. For this, he has been widely and deservedly praised. A second Great Depression was possibly avoided; the 1930s failure was not repeated. But the Fed has discovered that it lacks the power to resuscitate the economy single-handedly. Five years of short-term interest rates near zero and roughly $3 trillion of bond-buying have, at most, modestly improved a weak recovery. On its centennial, one word best describes the Fed: frustration.

Season Greetings

To all my readers, frequent or infrequent, in agreement or disagreement, I hope you have taken some pleasure, if not from my ramblings, at least from some of the charts. To all of you my very best wishes for this holiday season and for 2014.

If it has crossed your mind giving this scribbler a Xmas gift, pop by Amazon and buy my book with Benjamin Cole. And we hope you enjoy it.

All the best

Marcus