12, 24 or is it 36 hours to ‘doomsday’?

Just as confusing as the effects of the sequester itself is to figure out when it starts:

Leaders in Washington know they are approaching the moment when the so-called sequester spending cuts are set to take effect — but they apparently are confused about when exactly that moment is.

The White House confirmed today that President Obama will meet with congressional leaders to discuss the sequester on Friday, the day the sequester takes effect. That spurred congressional Republicans to criticize the president for scheduling a meeting after the sequester starts. Aides to both Senate Majority Leader Harry Reid, D-Nev., and House Speaker John Boehner, R-Ohio, told CBS News that the sequester officially becomes law at 12 a.m. ET on Friday – that’s midnight from Thursday into Friday.

Shortly after that, White House press secretary Jay Carney told reporters, “My understanding is it happens at midnight on Friday, 11:59.” In other words, the White House meeting would take place just before the sequester takes effect, not after.

In fact, the American Taxpayer Relief Act of 2012 (H.R.8 and Public Law 112-240) lays out the timing this way, in Section 901(e): “Sequester- On March 1, 2013, the President shall order a sequestration for fiscal year 2013 pursuant to section 251A of the Balanced Budget and Emergency Deficit Control Act of 1985.”

Congressional sources tell CBS that this effectively means the sequestration starts when Mr. Obama wants it to. By law, he must sign an order to start the sequestration some time – anytime – on Friday. At that point, the Office of Management and Budget will release a report on the specifics of agency cuts.

At that moment ‘doomsday’ will have arrived.

As ‘sparring’ for my arguments, I´ll single out Laura D´Andrea Tyson. In addition to being an academic (Haas School of Business UC-Berkeley), she´s also been Chairperson of the CEA and Head of the National Economic Council in President Clinton´s administration. In addition, she´s a ‘representative agent’ of those in the ‘doomsday camp’.

She recently wrote a piece at Project Syndicate with a catchy title: America´s Sequestered Recovery. According to her:

The United States is confronting another round of cuts in federal government spending, this time threatening to trim at least 0.5 percentage points from GDP growth and to precipitate a loss of at least one million jobs. Automatic across-the-board spending cuts, the so-called “sequester,” would reduce spending by $85 billion, with defense programs cut by about 8% and domestic programs by about 5% this year – and with additional cuts of comparable dollar amounts every year until 2021.

Anemic government spending, not profligacy, has been a major factor behind the economy’s lackluster recovery. According to a recent report by the Congressional Budget Office, large spending cuts by state and local governments – and, more recently, a significant reduction in federal spending – have contributed to the unusual and prolonged weakness of aggregate demand.

In recent speeches, US Federal Reserve Chairman Ben Bernanke and Vice Chair Janet Yellen have described fiscal policy at the local, state, and federal levels as a powerful headwind slowing the economy’s return to full employment. In the year after the recession ended, discretionary spending at the federal, state, and local levels boosted growth at about the same pace as in previous recoveries.

But, since then – and in sharp contrast to previous recoveries – fiscal policy has become contractionary, reducing aggregate demand and restraining growth. State and local governments have cut spending and payrolls significantly. And federal purchases of goods and services have been declining since 2010, when the temporary additional spending in the 2009 stimulus package came to an end.

As a result of a deep and persistent deficiency in aggregate demand, the US economy has been operating far below its potential output level. Real GDP fell by 8% relative to its noninflationary potential in 2008-2009, and has remained about 8% below its previous growth path ever since.

The significant loss of current and future potential output is all the more remarkable, because it has occurred despite a sustained and unprecedented effort by the Fed to boost demand and hasten the recovery. Fed officials have repeatedly expressed concern that the prolonged weak recovery will inflict future pain in the form of slower long-run growth.

I just love this last bit, but will leave comment on it for last.

Laura Tyson makes three statements to justify her conclusion, expressed in the title to the article, that “the sequester will ‘sequester’ the economic recovery”.

S1. In the year after the recession ended, discretionary spending at the federal, state, and local levels boosted growth at about the same pace as in previous recoveries.

Below the chart behind the statement.

Sequester_1

The statement seems ‘false’. Real Government (Federal, State & Local) Purchases during the first year of recovery were smaller than during the first year of recovery after the 1990/91 recession and way below purchases during the first year of recovery after the 2001/01 recession. Nevertheless, RGDP went up by as much as in the first year following the 2001/01 recession and significantly more than after the 1990/91 recession.

S2. But, since then – and in sharp contrast to previous recoveries – fiscal policy has become contractionary, reducing aggregate demand and restraining growth.

The Chart for the statement follows:

Sequester_2

Statement 2 seems ‘correct’. Growth is restrained when compared to the previous recoveries while government purchases have decreased. But it is worth noting that growth in 1992-94 was better than in 2002-05, despite real government purchases remaining ‘flat’ in 1992-94 while they increased in 2002-05.

S3. The significant loss of current and future potential output is all the more remarkable, because it has occurred despite a sustained and unprecedented effort by the Fed to boost demand and hasten the recovery.

The chart below is an imperfect but useful representation of the statement – sustained and unprecedented effort by the Fed. The chart compares nominal aggregate spending (NGDP) in the first year of recovery and during the subsequent 10 quarters.

We could agree on ‘sustained’ – after all, NGDP is growing. But as to ‘unprecedented’ we can agree it´s not! Spending growth, something closely controlled by the Fed, has been much smaller than in previous recoveries, especially in the ‘subsequent 10 quarters’. In other words, monetary policy is ‘tight’.

Sequester_3

It´s easy to say “it´s due to restrictive fiscal policy”, but I have my doubts. This cycle has been markedly different from other post war cycles, in particular regarding the ‘down phase’, so it may not be ‘illuminating’ to compare just the recovery phase of the cycles and emphasize the behavior of government spending (because, after all, monetary policy accommodation is ‘unprecetented’).

The next chart illustrates the recession phase of the cycle. It would be hard to argue that the depth of the recession was due to the absence of fiscal stimulus. Note that the initial stage of the recession was quite mild, especially when compared to the 1990/91 recession, despite comparable government spending. But while government spending kept on rising real output growth ‘jackknifed’ after mid-2008.

Sequester_4

The recession phase was longer and went much deeper than in the other occasions. But you wouldn´t have thought that possible by just looking at the behavior of government purchases. So let´s take a peek at the stance of monetary policy – represented by the behavior of NGDP – in the different recession phases.

Sequester_5

It certainly helps clear things up. There is total consistency, and note that it was only after monetary policy tightened the screws even more (despite lowering interest rates all the way to ‘zero’) that a run-of-the-mill recession – that could be compared favorably with the mild 1990/91 recession – turned “Great”.

The main lesson is that comparing the recovery phase of the different cycles is inappropriate and misleading because the recession phases were so markedly different. That also had the effect of increasing the public deficit and debt to much higher levels in this cycle than in other occasions. But it was raised above what it would have if monetary policy had not been – and still is – so restrictive.

Just to see how misleading it is just comparing the recovery phases of the cycle, from the chart below, describing the behavior of employment in recoveries, one would think that we´re doing much better than after the 2001 recession. But when you look at the recession phase, ‘reality slaps you in the face’. In other words, it´s not just growth rates that matter, and that´s what most people focus on. In the present case, ‘levels’ are defining.

Sequester_6

‘Bean counting at the BoE’

This morning Charles Bean, Deputy Governor of the Bank of England, took the opportunity of the NGDP release for the last quarter of 2012 to ‘deride’ NGDP targeting. I don´t really recommend reading his speech because it is an ‘unlearning’ process, and the ‘innocent’ would come out of it ‘worse-off’! He makes the mistake of first discussing the pros and cons of an NGDP growth target. In the second part he deals with level targeting.

Anyway, the FT/Alphaville has a summary, I´ll just focus on a couple of points and counter argue with illustrations (my bolds):

So the deviations of nominal income growth from around 5% appear to have been largely associated with forecast errors. In particular, the collapse in demand after the demise of Lehman Brothers was so sudden and deep that there was no way that monetary policy could in practice have been relaxed early enough, and by a large enough amount, to prevent it. It is, though, a moot point whether policy would have been set even more stimulatory during the latter part of 2009 if we had been operating under a nominal income growth target, given that we were implicitly expecting a rather slow recovery in nominal income growth. Given how stimulatory policy already was, I suspect that we might well have taken the view that it was simply not feasible to get nominal income growth back much faster.

This is one of the more ‘self-serving’ paragraphs I´ve read in some time. It was all due to the surprise of the Lehman shock. And later there was not much the BoE could do even if operating under a nominal income growth target because we were implicitly expecting a slow recovery in NGDP growth! Yes, Mr. Bean, the BoE has no influence at all on nominal spending. Could it be that exactly because you were expecting a “rather slow recovery in NGDP growth’ that growth turned out indeed slow?

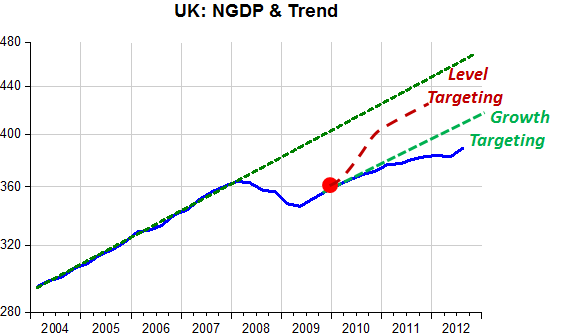
The charts below, which are two ways of showing the same thing, indicate that your Lehman ‘excuse’ does not hold water. By the time Lehman ‘folded’ NGDP had dropped way below the trend level path or, what comes to the same thing, NGDP growth had already fallen way below the 5% ‘target’. Could be that Lehman was the first ‘famous victim’ of the monetary policy folly that was taking place on the other side of the ‘pond’?

Bean_1

Bean_2

You could have ‘capped’ the depth of the hole by allowing NGDP to grow at 5% after late 2009, but you didn´t, and that´s certainly not a “moot point”.

“Anyway, he basically doesn’t believe that a shift to a nominal income growth target would represent a major change in the regime. Now to a shift to a target for the level of nominal income”.

such a target would ensure that past control errors have to be subsequently corrected. Bygones are not bygones, in other words. In the current context, this is usually taken to mean returning nominal income to a continuation of its pre-crisis trend line. As Chart 3 reveals, the nominal income shortfall in the United Kingdom is presently very large – in excess of 15% in fact.

Such history dependence in policy is potentially of value when private agents are sufficiently forward-looking and the regime is fully credible…

The problem is that such a policy is not time-consistent. The central bank has the incentive to say that it intends to do this. But once tomorrow comes, it makes sense not to go through with its promise of holding policy tight, as it suffers a cost in terms of output foregone, while the benefit has already been gained in the earlier period. It is better simply to renege on the earlier promise to keep policy tight for a while…

Oh, spare me! The time inconsistency argument is so lame. First because any monetary policy target is ‘time inconsistent’ if the central bank, responsible for defending the target, has no credibility. If it does have credibility (a conquest of several central banks over the past 25-30 years) deviations from the target path will never be big. If they are it is because the central bank ‘slept at the wheel’.

To your credit, although the UK economy had for long (since 1992) been ‘travelling’ along the same ‘spending route’, I cannot say you ‘slept at the wheel’ because that was not your target. But if there´s a lesson to be learned from this episode is that you had the ‘wrong target’. If it were a ‘good target’ it would not have driven you astray, way into the ‘soup’!

Update: A sense of humor is always important. And thanks to Steve Grissom we can get a good laugh watching Mr Bean steer the economy (see in comments).

Truly amazing!

Either Bernanke has no discernment or he is ‘making fools’ of the nation´s lawmakers.

The WSJ reports:

Federal Reserve Chairman Ben Bernanke laid out aggressive long-run markers for lawmakers consumed in budget battles with the White House.

While Mr. Bernanke wants Congress to avert the sequester and a sharp fiscal contraction in the short-run, he said the government should be focused on reducing debt levels in the long run. President Barack Obama has focused recently on stabilizing debt-to-GDP. Mr. Bernanke, in his testimony, effectively said that wasn’t enough.

“Between 1960 and the onset of the financial crisis, federal debt averages less than 40% of GDP,” Mr. Bernanke said. “This relatively low level of debt provided the nation much-needed flexibility to meet the economic challenges of the past few years. Replenishing this fiscal capacity will give future Congresses and Administrations greater scope to deal with unforeseen events.”

He´s ‘butting in’ on other peoples turf, diverting attention from his own very serious mishaps. Worse, his errors were directly responsible for the ‘debt explosion’. That´s because when interest rates were pushed down to ‘zero’ he was instrumental in asking for ‘fiscal help’, with many, or most, prodded along by the arguments of Mr. Krugman, convinced monetary policy had become ‘powerless’.

But Congress is very badly assisted and never asked Bernanke why he doesn´t set “aggressive long run markers” for the FOMC itself? Mr. Bernanke said stabilizing the Debt/GDP ratio wasn´t enough. Congress should have countered and asked why he thinks ‘stabilizing’ NGDP at such a low trend level path is enough, even if it implies a much lower level of employment.

But Bernanke is ‘proud’ to hold the best post WWII inflation track record.

The GOP is making Bernanke´s life ‘easy’

James Pethokoukis has this take:

“During Ben Bernanke’s Senate testimony this morning, Republicans again lambasted the Fed chairman for worrying too little about the inflationary potential of his low interest rate/quantitative easing monetary policy. From the WSJ:”

A testy exchange between Sen. Bob Corker (R-Tenn) and Bernanke. Corker says Bernanke has sparked a global currency war and created “faux” wealth. Bernanke says he’s not engaged in a currency war or targeting the currency. Corker says Bernanke is the biggest monetary ‘dove’ since World War II, proud of it and degrading society. Bernanke shoots back that he’s got the best inflation track record among Fed chairman since World War II. Corker says Bernanke is punishing savers with his low interest rate policies and throwing seniors under the bus. Bernanke says he’s looking out for long-term unemployed and that the stronger recovery he seeks will help savers. Following Corker’s advice, he adds, would throw the economy back into recession.

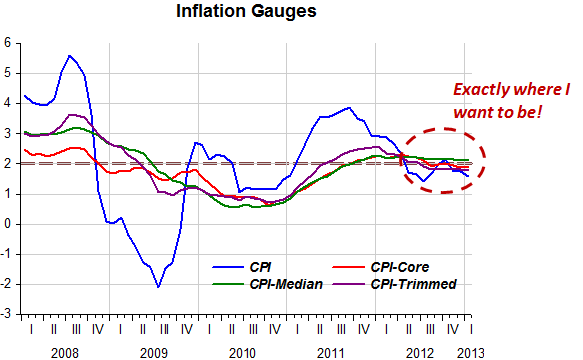
The GOP may think it´s giving Bernanke a hard time! Quite the contrary. Bernanke´s ‘defense’ is full proof. The most popular measures of inflation – the Core measures of the PCE and CPI (please, let´s avoid the ‘ups and downs’ of the Headline measures because they´re pretty uninformative about ‘trend’ inflation), in particular the Fed-preferred Core PCE, has never been so low, even quite a bit lower that the previously implicit and now explicit 2% target.

Corker_1

Bernanke responds that he´s “looking out for the long-term unemployed” by trying to engineer a ‘stronger recovery’. That´s the point Senator Corker (if he was assisted by a good economist) could have ‘nailed’ Bernanke.

He could say: Oh my! You really have the best inflation track record among Fed Chairmen since WWII, but on the other hand you have the worst aggregate spending (NGDP) growth record since the late 1930s! So tell me, how you can say with a straight face you´re “looking out for the long-term unemployed?  And you´ve been keeping rates at zero for more than four years without much to show in terms of growth and employment gains.

And then showed him any version of this chart:

Corker_2

The UK employment “puzzle”

Scott Sumner has done a post on “The British Miracle: exploding job growth during a recession.

The endlessly perplexing British economy continues to post bizarre jobs numbers:

The employment numbers continue to be surprisingly strong, with a rise of 154,000 to 29.73 million in the October-December 2012 period, and a huge 584,000 increase over 12 months. Interestingly, the rise in employment was more than accounted for by an increase in full-time employment of 197,000 in the latest three months, with part-time employment down 43,000.

NGDP, hourly nominal wages, and employment are the key macro variables.  The goal is to stabilize employment growth (or more precisely to prevent suboptimal employment fluctuations due to sticky wages.)  Stable NGDP growth helps, but is not perfect.

How did this jobs miracle happen?  Well let’s start with the fact that it may not have happened, the data might be wrong.  After all, RGDP has been flat, and Britain has been in recession during much of this time.

If it did happen, this might be one reason why:

Pay continues to be weak, up just 1.4% over the past year. More here.

If this refers to hourly nominal wages, it might help explain the jobs gains.  If it’s not hourly data, it’s meaningless.

However NGDP growth also seems to have been slow.

So if it’s not NGDP, what is the explanation?  Probably a combination of things.  For instance, falling North Sea oil output diverts production from areas using very few workers per dollar of NGDP, to areas using lots of workers per dollar of NGDP.

I have no pretense to know what´s behind the “puzzle” (maybe Britmouse can enlighten us), just thought it would be useful to present a comparative illustration. For example the AHW chart shows it´s not “weak pay numbers” that are making a difference (although inflation has been higher in the UK, lowering real wages). The similarities between the UK and US in the NGDP ‘gap’ and average hourly wages are significant. The employment difference is really a puzzle.

UK Puzzle_1

UK Puzzle_2

UK Puzzle_3


UK Puzzle_4

Vaffanculo!

In effect that´s what Italy been saying to politicians for many decades. Not to stray too far into the past, over the last 32 years Italy is coming up with the 20th PM. On average that´s a new PM every 18 months!

If this election was as bad as expected, there will be new elections in the next few months:

Instant polls released just after the close of the voting stations at 3 p.m. on Monday showed the center-left Democratic Party winning a majority in the lower house of Parliament. But projections released shortly after, based on early counting of actual votes, showed the center-right coalition run by former Premier Silvio Berlusconi leading in the upper house of Parliament, the Senate. That divide, if confirmed by the final vote tally, could steer the country back to a new election as early as this summer.

The panel below provide a glimpse of how monetary policy has been ‘bad’ for the big countries, being almost ‘tailor-made’ for Germany!

Italy_1

In terms of income per head (in comparable PPP units) we see that Italy stagnated over a decade ago. While up to the late 1990s it was at a par with France, now it is losing out. Not that France did well. While France has stagnated, Italy is seeing income per head fall.

Spain was on a strong ‘convergence’ path. It catched up to Italy but now sees its income per head drop in tandem.

Italy_2

Given that 3 out of the 4 largest EZ economies are in the ‘intensive care’ unit, how long will Mr. Ollin Rehn´s (the finnish EU economic affairs commissioner) optimism last?:

“The current situation can be summarised like this: we have disappointing hard data from the end of last year, some more encouraging soft data in the recent past and growing investor confidence in the future.”

When ‘mañana’ never comes

This is about potential real output. In March 2012 I posted “Another ‘bitch’: potential output” and concluded:

And the next chart gives up a “red light” indicating the possibility of “structural” problems being “brewed” by the complete absence of “cojones” (stronger Spanish word for “balls”) being shown by the Fed/FOMC!

The updated version of the chart follows:

mañana_0

Now, David Altig of the Atlanta Fed shows this chart

Mañana_1

And says:

The potential GDP line in that chart is the level of production that represents the structural path of the economy. Forecasters, no matter where they think that potential GDP line might be, all believe actual GDP will eventually move back to it. “Output gaps”—the shaded area representing the cumulative miss of actual GDP relative to its potential—simply won’t last forever. And if that means GDP growth has to accelerate in the future (as it does when GDP today is below its potential)—well, that’s just the way it is.

Unfortunately, potential GDP is not so simple to divine. We have to guess (or, more generously, estimate) what it is. That guessing game has been harder than usual over the past several years. Here is the record of the CBO’s potential GDP since 2010 (I show it including the actual course of RGDP):

Mañana_2

And concludes:

This much, in any event, is clear: Given any starting point where the level of GDP is below its potential level—that is, given an output gap—forecasts will include a bounce back in GDP growth above its long-run average, at least for a while. That’s just the way it works.

If, contrary to conventional wisdom, you believe that the true output gaps are much smaller than suggested in the CBO picture above, you might want to take the under on a bet to whether GDP forecasts will prove too optimistic once again.

God almighty, we´re down to ‘betting games’! It appears to be ‘God-given’ that how fast the economy grows (the ‘bounce-back’) depends on how far below ‘potential’ it is. Your job is to ‘guesstimate’ the ‘true potential’. The one who ‘guesstimates’ best will ‘win the pot’! Monetary policy has nothing (or not much) to do with that.

Let´s imagine that spending is a major driver of economic activity and also that the Fed has close control of spending. Imagine also that price/wages are sticky. What happens when, for some (sick?) reason the Fed allows nominal spending (NGDP) to take a plunge? Given stickiness of prices and wages it is a ‘sure thing’ that real output (RGDP) will also tumble. The crash in real output will make unemployment to soar/employment to tank.

Will the economy ‘spontaneously’ bounce back and do it at a rate that is in some sense proportional to the ‘gap’ that opened up? Or does the economy need to be ‘stimulated’?

The chart below shows NGDP relative to the “Great Moderation” trend level path.

Mañana_3

The next chart shows RGDP relative to the latest CBO estimate of ‘potential output’.

Mañana_4

What they show is that the economy is acting like a ‘mole’, digging an inclined hole underneath any reasonable level trend that could be imagined. Variables like employment show conformable behavior.

Mañana_5

What if, instead of resources being devoted to constantly more around the ‘goalpost’ – ‘potential output’ – the FOMC experienced an ‘epiphany’?

Unlikely. Note that inflation is right where the Fed wants it. That´s all that matters!

Mañana_6

Behind the ‘Abe Putsch’

There´s a good (long) story in Bloomberg on how Prime Minister Shinzo Abe is prodding Japan out of its lethargy:

Putting the final touches to his latest book in October, retired Yale University professor Koichi Hamada received a phone call at his Connecticut home. It was Shinzo Abe, whom he’d known for more than a decade and was running for a second shot at being Japan’s prime minister.

“I was really surprised,” Hamada, 77, who has campaigned for years for greater Japanese monetary stimulus, said in an interview from Wallingford, north of the campus where he used to teach. “I wrote him a summary of my views on the questions he asked about the role of monetary policy for recovery and reflation.”

(Yale University professor Koishi Hamada says that blaming the declining population for deflation is groundless, and that BOJ easing in February last year showed that monetary stimulus works by influencing expectations.)

Abe’s call, weeks before he retook power, underscores the rising role of a group of Bank of Japan critics who drifted to the margins of policy debates during the nation’s decade-and-a- half battle with deflation. Abe appointed Hamada to advise him on choosing the next BOJ governor. Etsuro Honda, 58, a Shizuoka University professor who wants a two-year window attached to the bank’s new inflation target, has a workspace next to Abe’s on the fifth floor of his office building across from parliament. Other reflationists summoned by Abe this year include Kikuo Iwata, 70, and Yoichi Takahashi, 57, who advocate a surge in Japan’s monetary base.

It seems that Princeton is ‘light years’ distant from Yale!

Matt O´Brien ‘nails it’

In The Atlantic Matt writes: “The 2% Mystery: Why Has QE3 Been Such a Bust”?

The best way to figure out what the Fed wants is to listen. After all, it tells us what it thinks will happen with GDP, unemployment, and inflation over 1, 2, and 3-year periods. Now, it’s GDP and unemployment predictions have been, in the spirit of generosity, a tad optimistic, but not so for inflation (which, not-so-coincidentally, is the only above variable the Fed controls directly). The chart below looks at the Fed’s core PCE inflation projections since late 2008; upper-range estimates for 1, 2, and 3-year periods are in red, and lower ranges ones are in blue. This is what a 2 percent inflation ceiling looks like.

Matt O´Brien

There’s a lot going on here, but there’s a depressingly simple message in this chart: QE3 isn’t working, because the Fed doesn’t want it to work.

Exactly one year ago I wrote “Obsessions are a formidable barrier to economic progress”:

In the second half of the 1980s, 1990s and first half of the 2000s, inflation AND unemployment remained contained. In my interpretation this favorable combination came about because the Fed in fact stabilized nominal spending along a trend path. Then Bernanke took over and brought with him the “obsession” with inflation. The outcome was the “Great Recession” (“Lesser Depression” or “Second Great Contraction”). Four years on we are still a long way from escaping this predicament because, just as in the 1970s, the “obsession” that “caused” the “GR” is alive and well.

One year has passed. QE3 has come along later supplemented by the Evans-Bernanke (threshold) rule, and the prospects have remained bleak. And the reason for that is the 2% obsession!

When you live in ‘la la land’, anything´s possible

Maybe that´s the case of Mr. Olli Rehn (from Finland), the EU’s economic affairs commissioner, who said in a statement:

“The current situation can be summarised like this: we have disappointing hard data from the end of last year, some more encouraging soft data in the recent past and growing investor confidence in the future.”

Mr. Rehn is the ‘almighty referee’ who decides if a country has disrespected the deficit target rule or has experienced ‘bad luck’. France is up for review and the commission’s winter report states:

The commission’s 143-page winter economic forecast gives some signals Mr Rehn is preparing to give France a reprieve. It states that new tax measures are expected to bring in additional revenues amounting to 1.5 per cent of GDP and explicitly states that much of the missed target is due to the economic downturn.

“Reprieves” are the norm:

Although Spain has been already given a waiver, the new data reveal just how difficult the road ahead is for Madrid to hit even the new, more lenient targets. Spain was supposed to lower its deficit to 5.3 per cent of GDP last year, but instead came in with nearly double that: 10.2 per cent, by far the highest in the EU.

This year, Spain’s deficit is projected to hit 6.7 per cent, well off the 3 per cent goal it was supposed to achieve. Without any additional austerity measures, Madrid’s deficit it projected to balloon again to 7.2 per cent in 2014, the forecast predicts.

And

The deepening recession will hit particularly hard in countries that have required EU financial assistance, particularly Greece, Spain and Portugal, which are expected to suffer deeper recessions this year and barely return to growth next year, according to the new forecasts.

Things could not be different because monetary policy in the Eurozone is strongly contractionary, and there´s no way that ‘two contractions” – fiscal AND monetary – can make for an expansion! The chart illustrates.

La la land