The Phillips Curve still lurks underneath FED thinking

Minnesota Fed Neel Kaskari published today “Why I dissented”, to explain the reasons for his dissent in the latest FOMC Meeting. His dissent has a dovish slant, but does not differ materially from the consensus view. In short, the relationship between inflation & unemployment, known as the Phillips Curve, is still very much alive in the Fed´s decision-making process:

“I strongly support the new Statement on Longer-Run Goals and Monetary Policy Strategy¹ that the Federal Open Market Committee has adopted. It incorporates the lessons we have learned from the prior recovery and gives the Committee sufficient flexibility to make up for periods of low inflation in order to achieve our dual mandate goals.

However, I voted against the FOMC’s September 16, 2020, policy statement because, while I believe the statement is a positive step forward in putting those lessons into practice, I would have preferred the Committee make a stronger commitment to not raising rates until we were certain to have achieved our dual mandate objectives.

The 2015 tightening cycle

To explain my rationale for seeking stronger forward guidance, I first must review what I learned from the recent tightening cycle that began in 2015. That policy tightening was predicated on the Committee’s view that the labor market was reaching maximum employment and therefore inflation was around the corner.

When I first became an FOMC voter, I dissented against all three of the Committee’s rate hikes in 2017 because, as I wrote then: “We are still coming up short on our inflation target, and the job market continues to strengthen, suggesting that slack remains.” ²

Recently, Governor Brainard commented: “had the changes to monetary policy goals and strategy we made in the new [monetary policy strategy] been in place several years ago, it is likely that accommodation would have been withdrawn later, and the gains [to the labor market] would have been greater.” ³

We misread the labor market and, as a result, the tightening cycle that we embarked upon was not optimal to achieving our dual mandate goals of maximum employment and stable prices.”

In recent years, we have repeatedly believed we were at or beyond maximum employment only to be surprised when many more Americans reentered the labor market or chose not to leave, increasing the productive capacity of the economy without causing high inflation. To me, maximum employment is the point at which the labor market is just tight enough to deliver 2 percent inflation in equilibrium.”

The highlighted segments indicate the close connection the Fed, even its more dovish members, see continue to exist between unemployment and inflation.

This is not surprising. In March of this year, Marco Del Negro, from the New York Fed, and coauthors presented a paper for discussion with reference to the New Statement on Longer-Run Goals titled “What´s up with the Phillips Curve:

Inflation has been largely disconnected from business cycle ups and downs over the past 30 years.  This puzzling observation is one more reason why the Federal Reserve should consider adopting a systematic monetary policy strategy that reacts more forcefully to off-target inflation—whether too high or too low.”

In What’s Up with the Phillips Curve?, the authors note that inflation in the United States has remained remarkably stable since 1990, even in the face of pronounced cycles in economic activity.  For example. the unemployment rate has fallen from a 25-year high of 10 percent in 2009 during the Great Recession to near 50-year lows of at or under 4 percent over the past two years.  But U.S. inflation hasn’t responded much to the steep drop in joblessness and remains somewhat short of the Fed’s 2 percent inflation target.

They don´t think monetary policy has been the major factor:

Changes in the conduct of monetary policy appear to have played some role in inflation stability in recent decades, but they cannot be its principal explanation, the authors suggest.

Their leading candidate for the driver of inflation stability is a reduced sensitivity of inflation to cost pressures—such as those associated with wage movements—or, in economic parlance, a decline in the slope of the Phillips curve.  This could be due to many structural forces—such as the increased relevance of global supply chains, heightened international competition, and other effects of globalization.

So, they recommend Average Inflation Targeting (AIT):

A flat Phillips Curve requires the monetary authority to work harder to stabilize inflation:  Unemployment needs to get lower to bring inflation back to target after a recession,” the authors write.  They use an econometric model to explore how monetary policy should adapt, examining, for example, a strategy known as average inflation targeting—one of several strategies the Federal Reserve has been evaluating during a public review of its monetary policy framework.

It´s a pity the Fed ignored much better advice, some from people advocating NGDP Level Targeting.

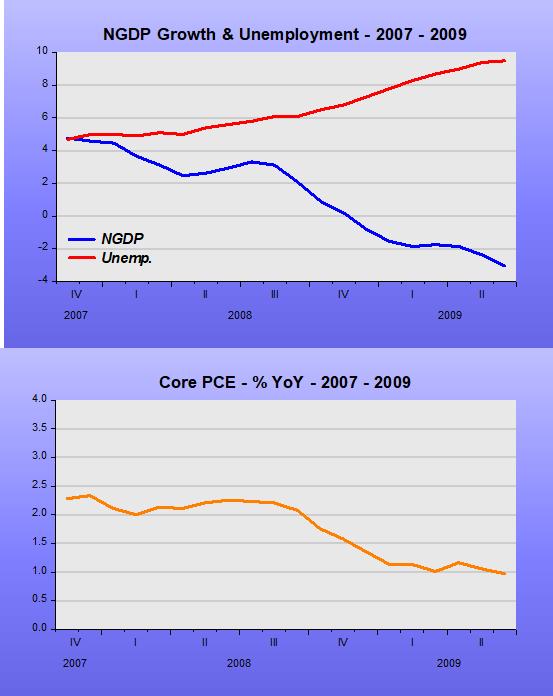
The panel below, covering the post Great Recession “Longest Expansion” provides interesting pointers.

  1. A stable NGDP growth is associated with falling unemployment (and stable inflation)
  2. When NGDP growth falls (below its average growth), unemployment stabilizes (stops falling) and when NGDP growth rises above its average growth, unemployment falls faster.
  3. The Fed´s juggling of the FF rate does not seem to connect to either inflation or unemployment (with unemployment falling “faster” during the period the FF was on the rise). That was more likely because NGDP was growing more.

FOMC members would do well to read and reflect on a recent paper by Alan Cole of the Senate´s Joint Economic Committee titled “A stable monetary policy to connect more americans to work”:

“The best anchor for monetary policy decisions is nominal income or nominal spending—the amount of money people receive or pay out, which more or less equal out economy-wide. Under an ideal monetary regime, spending should not be too scarce (characterized by low investment and employment), but nor should it be too plentiful (characterized by high and increasing inflation).

While this balance may be easier to imagine than to achieve, this report argues that stabilizing general expectations about the level of nominal income or nominal spending in the economy best allows the private sector to value individual goods and services in the context of that anchored expectation, and build long-term contracts with a reasonable degree of certainty. This target could also be understood as steady growth in the money supply, adjusted for the private sector’s ability to circulate that money supply faster or slower.

Bottom Line:

The Fed´s new strategy may just be a tweak on its old strategy in order to “accommodate” a belated realization that the Phillips Curve is (or has become) flat!

How´s the Fed doing in the make-up department?

The Fed´s new Statement on Longer-Run Goals and Monetary Policy Strategy is all about “making-up”; be it about inflation below target or unemployment shortfalls.

The Fed is not changing its ultimate mandate, which is to balance price stability with maximum employment. However, it has announced that it will no longer preemptively slow down the economy if the labor market begins to look tight and it will treat its 2% inflation target as an average.

Why the new statement? According to Lael Brainard, since the end of the “Great Recession” the US economy has been in a “new normal”. Three things characterize “new”:

  1. The equilibrium interest rate has fallen to low levels, which implies a large decline in how much we can cut interest rates to support the economy.
  2. Underlying trend inflation appears to be somewhat below the Committee’s 2 percent objective, according to various statistical filters.
  3. The sensitivity of price inflation to labor market tightness is very low relative to earlier decades, which is what economists mean when they say that the Phillips curve is flat.

How does that compare with the “old normal” (Great Moderation)?

  1. The equilibrium or neutral interest rate was never a concern. It averaged 2.3%, close to the 2% John Taylor pinned it at in his 1993 Taylor-rule. Since the end of the GR it has averaged 0.3%.
  2. In the “old normal”, core PCE inflation averaged 2.1%, almost exactly the 2% that was the implicit target at the time. During the “new normal”, it has averaged 1.6%.
  3. The “low sensitivity of price inflation to labor market tightness was already low relative to previous decades. For example, speaking in 2007, Bernanke 2007 said:

“…many studies of the conventional Phillips curve find that the sensitivity of inflation to activity indicators is lower today than in the past (that is, the Phillips curve appears to have become flatter);1 and that the long-run effect on inflation of “supply shocks,” such as changes in the price of oil, also appears to be lower than in the past (Hooker, 2002).

The “new normal” mindset leads to comments such as these:

“Monetary policy is really good for playing defense,” said Adam S. Posen, president of the Peterson Institute for International Economics. “But not for playing offense.”

“If the Fed is relatively weak in its ability to end recessions, why do its actions get so much attention during times of economic crisis? Mostly because the actions of Congress (dominated for the past decade by the Republican caucus in the Senate) have been either too weak or outright damaging during these crises. For example, in the weak recovery from the Great Recession of 2008-2009, austerity imposed by a Republican-led Congress throttled growth, even as historically aggressive actions by the Fed tried (only partly successful) to counter this fiscal drag.”

That´s interesting because during the “Great Inflation” of the 1970s, Fed Chair Arthur burns thought the Fed could not play defense, but under the right circumstances, it could be good at playing offense!

Arthur Burns:

“Another deficiency in the formulation of stabilization policies in the United States has been our tendency to rely too heavily on monetary restriction as a device to curb inflation…. severely restrictive monetary policies distort the structure of production. General monetary controls… have highly uneven effects on different sectors of the economy.”

Burns did not consider monetary policy to be the driving force behind inflation. He believed that inflation emanated primarily from an inflationary psychology produced by a lack of discipline in government fiscal policy and from private monopoly power, especially of labor unions. It followed that if government would intervene directly in private markets to restrain price increases, the Federal Reserve could pursue a stimulative monetary policy without exacerbating inflation.

The new and old normal share characteristics:

  1. In both cases, NGDP growth, RGDP growth and inflation were stable, albeit at lower rates in the new normal
  2. Phillips Curve thinking was the wrong mindset in both cases. It was a very costly mistake in both instances.

The question that naturally comes up is “what led us from one state to the other”?

The two states are illustrated by the behavior of aggregate nominal spending (NGDP).

In both, NGDP is stable along a level path. We can infer that those paths and associated growth rates were chosen, (were not accidental). The same goes for the inflation rate that averaged a stable 2.1% in the old normal and 1.6% in the new.

The transition from one state to the other took place in 2008-09. In the chart below, we see that both NGDP and money supply growth tanked and inflation shifted down from 2% to 1%.

The Fed never tried to make up for the drop in NGDP and inflation, resuming expansion along a lower level path and lower rates.

The next chart zooms in on the “new normal” chart shown in the first picture above. To explain the recent behavior of nominal spending (NGDP), I use the QTM (Quantity Theory of Money).

According to the QTM, MV=Py, to keep nominal spending (Py) growing at a constant rate, money supply (M) has to offset changes in velocity (V).

The chart shows five regions. In region 1, the Covid19 surprise increased the demand for money (velocity falls). Since the money supply barely changed, NGDP drops. In region 2, the Covid19 shock intensifies the demand for money (velocity drops more). Although money supply growth rises, it does so by less than required to keep NGDP at least stable. In region 3, velocity stabilizes while money supply growth increases. NGDP rises. In region 4 money still grows somewhat, but so does velocity, with the result being a further rise in NGDP.

In region 5, which covers the latest data point (July), we see that money growth stabilizes. Velocity, however, rises somewhat so NGDP increases but at a slower rate.

Maybe the Fed was influenced by the large number of articles and op-eds decrying that the unprecedented rates of money growth would lead to an inflationary boom down the road. In any case, money growth stopped rising. In that case, the rise in NGDP was fueled only by the small rise in velocity.

It appears, therefore, that we face a situation not of excessively strong money supply growth, but once again, although for very different reasons, a case of “not enough money”. For NGDP to rise back to the “new normal” trend, money growth will have to increase more, unless velocity rises faster,

The danger is that the Fed will not make up fully for the drop in NGDP, starting on a “new-new normal”, characterized by an even lower level of aggregate nominal spending. The new target of getting inflation to average 2% will also remain a distant dream…

Brainard´s “New Normal” is Old

Lael Brainard´s speech on the Fed´s new “longer-run goals and strategies makes reference to a “New Normal”: [I only highlight her references to the labor market]

“The new statement on goals and strategy responds to these features of the new normal in a compelling and pragmatic way by making four important changes.

First, the statement defines the statutory maximum level of employment as a broad-based and inclusive goal and eliminates the reference to a numerical estimate of the longer-run normal unemployment rate.6 The longstanding presumption that accommodation should be reduced preemptively when the unemployment rate nears the neutral rate in anticipation of high inflation that is unlikely to materialize risks an unwarranted loss of opportunity for many Americans.

Third, the statement highlights an important change in the Committee’s reaction function. Whereas previously it sought to mitigate deviations of employment and inflation from their targets in either direction, the Committee will now seek “to mitigate shortfalls of employment from the Committee’s assessment of its maximum level and deviations of inflation from its longer-run goal.” This change implies that the Committee effectively will set monetary policy to minimize the welfare costs of shortfalls of employment from its maximum and not preemptively withdraw support based on a historically steeper Phillips curve that is not currently in evidence and inflation that is correspondingly much less likely to materialize.

… Beyond that, had the changes to monetary policy goals and strategy we made in the new statement been in place several years ago, it is likely that accommodation would have been withdrawn later, and the gains would have been greater.”

What she really shows is that the post Greenspan FOMC has continuously misinterpreted the economy.

The panel below clearly illustrate that during the 1990s and early 2000s (before the Great Recession), a stable growth rate for nominal spending (NGDP) was what was required to keep the rate of unemployment on a downward trend while inflation either fell or remained low & stable.

The same remains true for the post GR period.

When the Fed makes a big monetary policy mistake and allows nominal spending to tank, the consequences are also big. This was the case in the monetary-led Great Recession. NGDP tanks while unemployment balloons. Inflation dropped by 50% (from 2% to 1%).

Four years ago (Sept 16) Lael Brainard made a speech with the title: “The New Normal and what it means for Monetary Policy”. One of the key features of the New Normal was:

  1. Labor Market Slack Has Been Greater than Anticipated
    Second, and related, although we have seen important progress on employment, this improvement has been accompanied by evidence of greater slack than previously anticipated. This uncertainty about the true state of the economy suggests we should be open to the possibility of material further progress in the labor market. Indeed, with payroll employment growth averaging 180,000 per month this year, many observers would have expected the unemployment rate to drop noticeably rather than moving sideways, as it has done.

The next chart zooms in on 2016 to indicate the “cause” of the sideways move in unemployment. You easily see it was due to the excessive drop in NGDP growth from the 4% average that prevailed in the 2010 – 2019 period. The same happened 20 years before. The Fed should have picked on this “pattern” some time ago! As seen in the previous charts, once NGDP growth picks up again, unemployment resumes the down trend.

So, using new words for the “target” – AIT – and new words for the “reaction function” – shortfalls – will likely change very little.

When danger looms, the NGDP-LT dog barks, the other dogs stay silent

David Beckworth brings attention to this interview with James Bullard where it he implies that the new AIT framework is equivalent, or approximates NGDP-LT.

That´s not true. The Great Recession was the result of the Fed “downgrading” the NGDP target level, and then continuing to practice NGDP-LT at a lower trend path (accompanied by a lower growth rate). However, AIT (or IT, or PLT) continued on the same trend path as before.

The charts illustrate. Until 2006, all those “targets” were “observationally equivalent”. You wouldn´t know if the Fed was targeting the average PCE core inflation, the PCE core price level or PCE core inflation. It could also be targeting NGDP at a particular level and growth rate.

From that point on, the NGDP-LT dog began barking to remind the Fed that it was being “derailed”. The other dogs remained on the path so the Fed, who never imagined that the overall nominal stability it had successfully attained (Great Moderation) was due, not to targeting inflation, average inflation or the price level, but to targeting NGDP at a particular trend path, was stunned by the depth of the recession.

A “new” and lower trend path for NGDP was followed after the shock, and that´s why the economy has been nominally stable since the end of the GR. Unfortunately, it is a “depressed” level of nominal stability. Given the new AIT framework, we risk, as I argued here, to “depress” the economy further following the Covid19 shock!