From a recent Vox post: “The tail that wags the economy: The origin of secular stagnation”:
The Great Recession has had long-lasting effects on credit markets, employment, and output. This column combines a model with macroeconomic data to measure how the recession has changed beliefs about the possibility of future crises. According to the model, the estimated change in sentiment correlates with economic activity. A short-lived financial crisis can trigger long-lived shifts in expectations, which in turn can trigger secular stagnation.
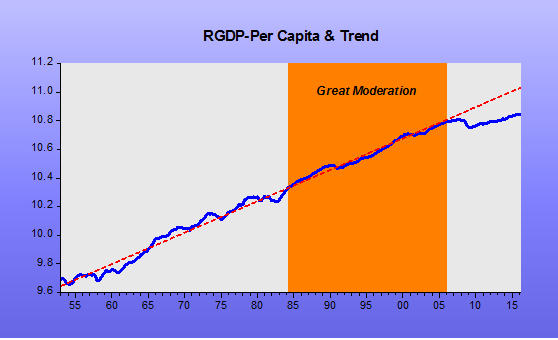
The typical post-WWII recession has a distinct trough, followed by a sharp rebound toward a stable trend line. Following the Great Recession, however, this rebound is missing. The missing recovery is what Summers (2016) and Eggertsson & Mehotra (2014) call ‘secular stagnation’ (see also Teulings and Baldwin 2014).
And show a version of this chart
Why did the dysfunction in credit markets impact the real economy for so long? Many explanations for the real effects have been advanced, and these are still being compared to data (e.g. Gertler and Kiyotaki 2010, Brunnermeier and Sannikov 2014, and Gourio 2012, 2013). Existing theories about why the crisis took place assume that the shocks that triggered it were persistent. Yet such shocks in previous business cycle episodes were not so persistent. This differential in persistence is just as puzzling as the origin of the crisis. What most explanations of the Great Recession miss is a mechanism that takes some large, transitory shocks and then transforms them into long-lived economic responses.
Perhaps the fact that this recession has been more persistent than others is because, before it took place, it was perceived as an extremely unlikely event. Today, the question of whether the financial crisis might repeat itself arises frequently. Financial panic is a new reality that was never perceived as a possibility before.
I believe there´s a simpler and more direct explanation – or mechanism – consistent with the changes in “beliefs, expectations or sentiment” which, in addition to helping understand the fall in productivity growth, is also consistent with the post war history of the behavior of RGDP depicted in the chart above.
That alternative explanation relies on observing that what is manifestly different in the present cycle is the behavior of monetary policy, if you understand monetary policy to be the main determinant of aggregate nominal spending (NGDP).
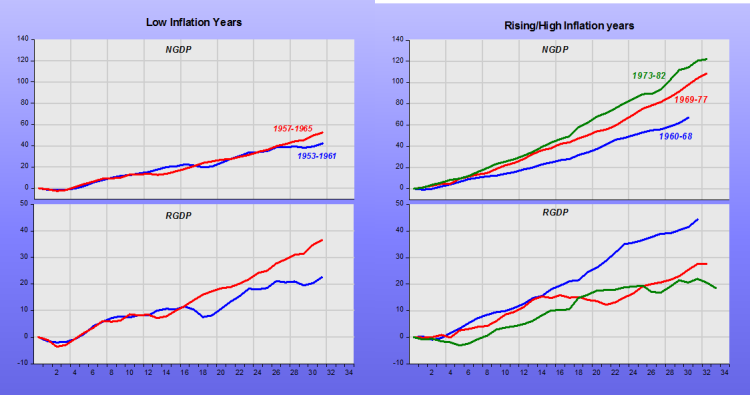
My strategy divides the post war period (actually the period after 1953, to avoid complications from the immediate post war years and the period of the Korean War) in four parts. The “low inflation” 1950s and early 1960s, the “rising-high inflation” of the late 1960s to the early 1980s, the “falling-low inflation” years from the mid-1980s to 2006, and the “Great Recession/Great Stagnation/Too Low Inflation” years thereafter.
In this story, it´s not “the tail that wags the economy”, but the “hydra-head” of the FOMC, who wields close control of aggregate nominal spending in the economy.
The panel depicts NGDP and RGDP during the four episodes. All corresponding charts have the same scale and they cover the period from the peak of the cycle to 28 quarters from the trough (which is the time span since the Great Recession ended in June 2009).
From looking at the behavior of NGDP and the associated behavior of RGDP during the episodes, it becomes clear why we´re living a Great Stagnation. For the past 60 years, monetary policy has never been this tight! That´s the mechanism that transforms transitory shocks into long-lived economic responses.
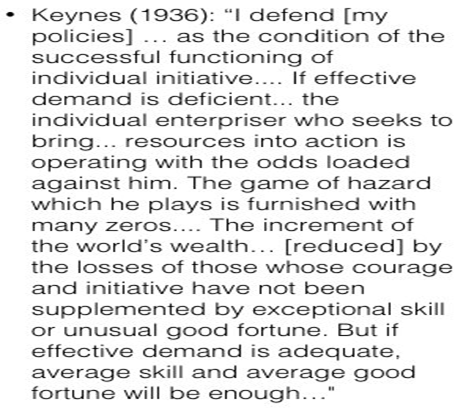
And on the productivity implications of inadequate AD growth, this was tweeted by Adam Tooze:
Keynes on the aggregate demand context necessary for rapid productivity growth


