Last year I said the Economic Report of the President (ERP) “lacked character”. This year I looked out for it in February but delays in voting the budget delayed the 2013 ERP, which was released in March. I had completely forgotten about it and my memory lapse wasn’t helped by the absence of notice and comments at the time of the release.
For some reason I thought about it today. Wish I hadn´t because right in Chapter 2 (The year in review and the years ahead) I labeled it a “misleading” ERP.
With regards to Figure 2-3 this is what they write:
Private-sector job growth during the current recovery has been roughly comparable with that in the 1991 recovery and noticeably faster than in the 2001 recovery, as illustrated in Figure 2-3. As is typical, the recovery in hiring since 2009 lagged the recovery in output. Private nonfarm payrolls in the current recovery began growing 9 months after the business cycle trough. By comparison, payrolls first began expanding consistently 12 months into the 1990–91 recovery, and sustained private-sector job growth in the 2001 recovery did not begin until 21 months after the official end date of the recession. Thus, although the 2007–09 recession lasted longer and led to deeper job losses than did the recessions of 1990–91 and 2001, recovery in the labor market began somewhat sooner.
Figure 2-3 is a version of the chart below, where NFP is Non-Farm Payroll and includes public sector jobs. The data are normalized to 100 at the through of each cycle and economists at the CEA focused on private-sector jobs because it gives rise to a “better” story.

What´s misleading about the chart is that the reader is subtly prodded to look only at the recovery because that allows the CEA to spin a better tale.
A better ‘geometry’ of this recession is given by the set of charts below.
The first sets out the overall landscape, showing how closely nominal spending (NGDP) ‘hugged’ the trend over the years.

In the 1990 cycle NGDP fell back to trend and then kept growing at the trend rate (Gap=0).
After mid-1998 the Fed allowed NGDP to grow above trend and when they tried to bring it back to trend they undershot significantly, becoming surprised that low rates were not helping bring the economy back to trend. The introduction of ‘forward guidance’ in mid-2003 ‘solved’ the problem. In March 2009, QE1 was only ‘good enough’ to break the speed of the fall relative to the trend level.
The next chart illustrates the close association between what´s happening to NGDP and overall employment (NFP). The NFP data is normalized to 100 at the cycle peak while the horizontal axis shows the number of quarters employment took to regain the cycle peak level. NGDP for each cycle extends up to the quarter employment regained the previous peak.

In the 1990/91 cycle decelerates enough to return to trend and from then on evolves very close to the trend level, growing close to the 5.5% trend growth rate. Employment falls only a little and quickly regains the previous peak.
In the 2001 cycle NGDP decelerates too much, bringing spending far below trend. Employment drops by more than in the previous cycle and remains ‘depressed’ until NGDP starts rising back to trend once the FOMC adopted ‘forward guidance’.
In the ongoing cycle, NGDP falls way below trend and QE1 was just sufficient to brake the fall. NGDP rises but grows below the trend growth rate, continuing to distance itself from the trend level. Employment recovers very slowly, remaining far below the previous peak almost four years after the start of the ‘recovery’.
Does fiscal stimulus have the same ‘explanatory power’ as monetary policy (NGDP)? The next chart shows the behavior of one measure of fiscal stimulus – Federal Government Consumption & Gross Investment (Government Purchases) – during the cycles.
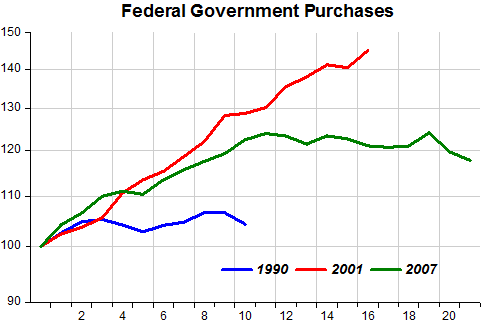
Note that the 2001 cycle had the strongest expansion of Government Purchases. That didn´t help much, with the economy only gaining traction and employment rising after monetary policy became more expansionary with forward guidance.
In the present cycle fiscal policy stopped being stimulative more than 2 ½ years ago, but that has not stopped the economy chugging along to the ‘slow beat’ of monetary policy. If only the ‘drum beat’ could be louder…
