In the comment section of Scott´s “A NGDP counterfactual” Peter N shows this – as he says ugly – chart:

and writes the following story (my highlights):
You can see that until the mid-1980s the ratio of net worth to GDP was fairly stable around 3.5 and liabilities as a percent of net worth after a run up after WWII from, 7% to 14% around 1965 stabilized there. I interpret this as healthy borrowing, since it had no effect on the ratio of net worth to GDP – that is it caused net worth and GDP to increase at an equal rate.
What happens next is the great dotcom stock market boom. This produces some asset inflation, but it’s mostly just the irrational exuberance of people investing their own money. You see that the increase in (net worth/GDP) is pretty much entirely due to an increase in financial assets.
After the dotcom bust, however, the Fed loosens, arguably for too long, and another asset inflation up leg follows without the preceding inflation having been completely wrung out.
Unlike the previous boom, this one is fueled by debt leverage taking liabilities as a percent of net worth from 16% to 26%. Regardless of whether you believe this was rational, it clearly wasn’t sustainable, and a naive reading of the chart would indicate that we’ve only retreated 3/4 of the way to historically normal levels (which, I suspect is a lot more than the Europeans have managed).
There are 2 possibilities. Either:
1) the 4.8 ratio of net worth to GDP was sustainable, and it should have been supported by fiscal or monetary policy depending on your persuasion in that area.
2) The ratio wasn’t sustainable, and it should have been allowed to fall with the fall being cushioned by some combination of fiscal or monetary policy again depending on your persuasion.It seems to me, however, that the choice of policy depends to a large extent on whether you believe 1 or 2 above.
The chart below shows Liabilities as a percentage of Net worth (leverage). Peter argues that from 1965 to the early 1980s, the stability of this ratio is an indication of “healthy borrowing”. I would interpret it very differently. Since the relative stability of ‘leverage’ takes place during the period of the “Great Inflation” it more likely means people were averse to borrowing. There was simply too much uncertainty in the outlook. Remember price controls, oil shocks and go-stop monetary policy.

‘Leverage’ takes off again during the “Great Moderation”, a period in which the outlook became much less risky or even uncertain.
The behavior of the stock market is a reflection of this less risky environment, not an “irrational exuberance” of investors ‘gone mad’. Even the dotcom boom, which went on for a short period in the late 1990s, was likely not an irrational response by investors.

I´ll skip straight to Peter´s punch line:
After the dotcom bust, however, the Fed loosens, arguably for too long, and another asset inflation up leg follows without the preceding inflation having been completely wrung out.
Unlike the previous boom, this one is fueled by debt leverage taking liabilities as a percent of net worth from 16% to 26%.
The chart below puts together the NGDP gap and ‘leverage’. In the late 1990´s the Fed errs in the direction of excessive nominal growth (excessive relative to the trend path) and in the early 2000s it was excessively contractionary. Initially there is ‘deleveraging’ and then ‘leveraging’. But as seen we don’t´ have a “boom fueled by ‘exploding’ leverage. The house boom was mostly the result of distorted homeownership incentives while the growing ‘leverage’ was the result of inadequate NGDP growth.

In mid-2003, when the Fed adopted ‘forward guidance’ NGDP began to travel back to trend and ‘deleveraging’ set in. Unfortunately, Bernanke´s inflation phobia was instrumental in letting NGDP fall back away from trend, setting the scene for the late-2008 debacle! The chart also indicates what would likely have happened if NGDP had not first ‘boomed’ in the late 1990s and then tanked in the early 2000s. If NGDP had evolved along the dotted line, quite likely ‘leverage’ would have remained stable.
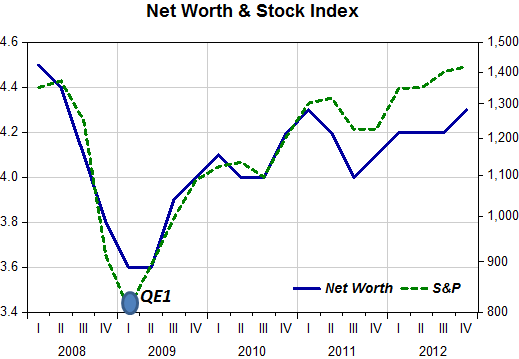
This is what happened in 2008 and after:

Note that QE1 (March 2009) was instrumental in braking the fall in nominal spending. Although nominal growth resumed, it did so at a rate that has been too low to close the gap. It has nevertheless allowed ‘deleveraging’ to take place, in part because Net Worth has increased following stock market gains.
Just as David Beckworth has argued in the case of Europe, in the US it was also (at least mostly) an NGDP fueled crisis.
So Peter, it´s not a question about your alternatives (1) or (2), but about not letting monetary policy (NGDP) get out of ‘whack’. And if it does devote all efforts to take it back to its ‘rightful place’!

I think Peter is falling into a fallacy of composition. If an individual’s debt rises too far above his income, then it becomes unsustainable.
However, when we aggregate, what is a liability to the debtor is an asset to the creditor. Net debt is zero.
The debtors can pay off creditors by selling them things.
The false intuition is that debtors produce goods and services and earn income, but they use the income to pay their debts. There is no income left to buy what was produced.
But the creditors receive that money that debtors pay, which is used to produce output.
How could there be a problem? If we assume that creditors hold the money that they receive in payment rather than spend it. Debt repayment is assumed to be an increase in the demand for money.
It could be, but it isn’t necessarily so.
Excellent post! Until you got to the punchline I was wondering what leverage as a percent of net worth has to do with anything. Peter N’s graph is ugly; a whole lot of squiggly lines with no logic that connects them to a source of instability (or does he suppose that readers will just naturally fill in the gaping chasm to meet him?). As long as people can service their debt there’s no problem – but something has to happen to make it difficult to do so. And to your point, collapsing NGDP is the thing that amplifies the burden.
Unfortunately you don’t get to preview on Scott’s blog, and that was a slightly earlier and more confusing version than the one FRED said I was linking to. I was also trying to show 2 things at once, which usually just ends up causing confusion. Here is a much simpler version
http://research.stlouisfed.org/fredgraph.png?g=in0
we seem to be using somewhat different net worth numbers. All my data series are for households and nonprofits.
You slightly misinterpreted what I thought was healthy. I was referring to the period from WWII to LBJ’s decision to have both guns and butter in 1968. I’m skipping over the great inflation, not because it isn’t interesting or important, but because the net worth and liability numbers are stable . Furthermore, I think most of the dotcom boom was healthy, since, while it may have been irrational exuberance, it wasn’t financed with borrowed money.
I’m afraid I’m not a believer in NGDP gap counterfactuals (or most other counterfactuals, either).
I do believe tight credit was partly to blame for the bad result.
Here are the Divisia monetary aggregates at 3 different resolutions:
http://www.centerforfinancialstability.org/amfm/Charts2_amfm1.gif .
What happens in the second half of 2008 is a disaster. Moreover, if you compare M4 with M4- you can see the flight to quality. You have 3 problems at once. There’s a loss of low information collateral, an increase in haircuts, which increases the demand for collateral, and a reduction in rehypothecation, which results in a loss of velocity. This is a very bad combination.
The question remains can the liabilities as a percent of net worth and net worth as a percent of GDP grow indefinitely, or are they subject to Stein’s Law?
If it’s the latter,how do you prevent a crash landing?
As for there being a creditor for every lender, so what. Here’s one take on the subject:
Wealth and Volatility
Johnathan heathcote
Minneapolis Fed
Fabrizio Perri
Minneapolis Fed
EIEF July 2011
Click to access HeathcotePerri.pdf
Debt is a complicated subject and deserves to be dealt with on it’s own, but
1) GDP accounting hides the introduction of credit into GDP, because GDP=GDI=GDE always by definition. This is true even for insane open loop economies where money comes from nowhere, finances production and is then burned by labor.
2) If debt doesn’t matter, it’s rather hard to explain Europe, for instance.
3) When a bank lends, its liability is called a deposit, and serves as money for the depositor-borrower. The loan is an asset of the bank, and is credit money. This expands the amount of money (inside+outside), and the expansion ends up.as investment, which is magically instantly also expense and income. GDP, GDI and GDE all expand pari passu..
4) Creditors and debtors don’t have either the same utility functions or the same propensity to consume. Bill Gates, won’t go out to dinner at McDonalds several million times a day.
5) Economics has never solved the problem of value. There is an obvious problem with valuing assets stocks at current flow prices. These prices could never be realized, should enough people want to sell at once. Should they want to do so, the possibility of a feedback loop ought to be obvious.
The other thing I wanted to show was that the increase in total assets and net worth can be completely explained by increases first in the public equity and then the real estate components. Hardly surprising.
And speaking of counterfactuals, there’s this chart -: Let’s make the Great Recession vanish:
http://research.stlouisfed.org/fredgraph.png?g=inc
Bill Woolsey,
Yes, for every debtor, there is a creditor, But,this issue lives at the nexus between 2 perennial problems of economics – stocks and flows and value.
The value of the debt is nominally fixed. The value of the collateral isn’t. Furthermore the stock of collateral is valued at flow prices, whereas the debt isn’t. Given any situation which is the equivalent of a stock marking to market at a time of falling flow prices, and a lack of sufficient solvency (lack of liquidity is an easier problem for a central bank) to absorb the nominal losses, and you have an accident waiting to happen. Of course lack of liquidity + lack of credit produces insolvency.
You have a feedback gain proportional to the stock to flow ratio. It’s that simple. If you exceed your gain (solvency) margin, you’re toast.
You can see the dimension of the problem, if you notice that the government is going to make a handsome profit (compared to its cost of funds) on its investments in the GSEs..Where did those $300 billion of losses go?
You can’t fight Marcus Nunes and his charts.
Great as always! These people really believe there is some sustainable leverage ratio that should be targeted. Ive been meaning to write a post about similar stance by R. Koo. I thought his view implicated that government should target some ratio, but PeterN states it explicitly. On the other side Koo claims there is a liquidity trap. Definitely going to link to this post.
Greets!
“Since the relative stability of ‘leverage’ takes place during the period of the “Great Inflation” it more likely means people were averse to borrowing.”
Changes in leverage can be explained by financial inertia plus changes in interest rates and GDP growth. Inflation suppresses leverage, and disinflation boosts leverage, independently of borrowing behavior.
For more of this line of argument see:
http://slackwire.blogspot.com/2013/04/borrowing-debt.html